My third project at Metis consisted of diving into the wonderful worlds of APIs and classification metrics. But mostly, it was about facing the music…
Music accompanies us on every aspect of our lives. It enhances our activities, whether it be work, play or rest. I was interested in predicting how music evokes feelings, as the common denominator of shared experience for all music consumers. With individual songs tied to mood labels, it seemed feasible to be able to use audio and track features to predict the mood of a song.
There are many reasons why there would be a business case for this sort of problem - after all, moods and emotions are often what drive consumer purchasing decisions, which would be well within a record label, streaming provider or brand manager’s purview. Some possible use cases of these predictions fall into two categories:
-
Association with music: For many consumer facing companies (e.g., retail, restaurants), music is part of a brand’s identity. Mood classification can help to determine what kinds of songs evoke a brand’s image, and help create atmosphere for spaces and events.
-
The music industry: Mood classification is increasingly becoming its bread and butter; identification of moods can help with music recommendations, label/artist management, assembling music metadata and creating album, artist or playlist mood profiles.
I chose to hone in on the concept of mood profiles for my project - could we use the predictions to create a mood profile for a potential streaming music service user and accurately represent their tastes?
Feel free to check out my code on my github!
Data Acquisition and APIs
Determining how to compile a database of songs with mood labels presented a unique challenge. There are several large song datasets that have been made available by researchers, most notably the Million Song Dataset. However, this is now dated as it was released in 2011, and I wanted to incorporate more recent music.
Several music databases and music streaming services have APIs - which are intended for one to build software applications on their services, but also means access to their rich sources of data (provided one doesn’t get rate limited along the way!). In particular, Spotify and GraceNote both had great documentation (with convenient Python interpretations in the form of Spotipy and pygn) that allowed one to access their services. Special mentions go to the unofficial Billboard API billboard.py; while I didn’t eventually incorporate charting information, it was easy to use and allowed one to pull song information from any billboard chart.
To generate a database of songs, I wrote a script to access Spotify’s categories from the Spotify API. Spotify has several categories of music that represent genres and activities (e.g, Chill, Rock, Country, Party, etc.) and pre-built playlists of songs segregated by category. From this structure, I was able to pull the unique identifiers of over 26,000 songs!
import spotipy
import spotipy.util as util

token = util.prompt_for_user_token(<INSERT SPOTIFY USERNAME>,
                                  client_id=<INSERT SPOTIFY CLIENT ID>,
                                  client_secret=<INSERT SPOTIFY CLIENT SECRET>,
                                  redirect_uri=<INSERT REDIRECT URI>)

spotify = spotipy.Spotify(auth=token)

# get categories
def get_categories():
    category_ids = []
    for i in spotify.categories(limit = 50)['categories']['items']:
        category_ids.append(i.get('id'))
    return category_ids

# get playlists from list of categories
def get_playlists(categories):
    playlist_ids = []
    for i in categories:
        for j in spotify.category_playlists(i, limit = 50)['playlists']['items']:
            playlist_ids.append(j.get('id'))
    return playlist_ids

# get song ids from list of playlist ids
def get_songs(playlists):
    song_ids = []
    for i in playlists:
        try:
            for j in spotify.user_playlist('spotify', i)['tracks']['items']:
                song_ids.append(j['track']['id'])
        except:
            pass
        time.sleep(.1)
    return song_ids

categories = get_categories()
playlists = get_playlists(categories)
songs = get_songs(playlists)
I then used the song IDs to query Spotify for audio features and other track metadata for each song, such as popularity and explicitness, joining all of the information in a Pandas dataframe.
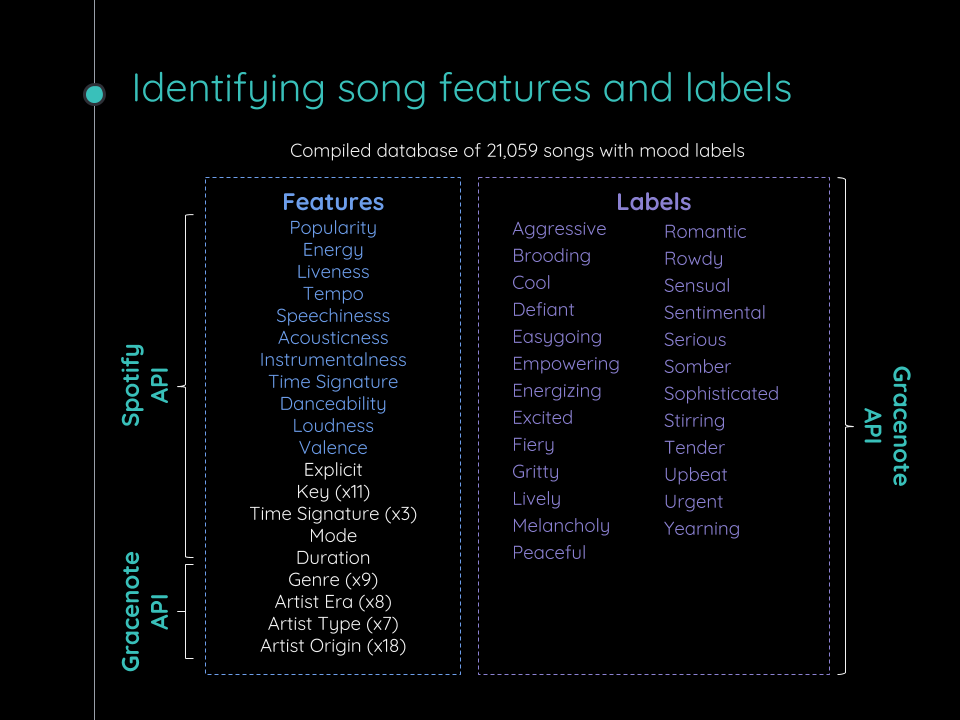
One of the things that was important to me was being able to compile audio metadata across different sources; and as such, being able to tie song records to each other was key. Unfortunately, no other music data sources besides Billboard had Spotify ID information, and as such I needed to use artist-song matching to compile the rest of the database. From Gracenote, I was able to use use my Spotify database of songs as a starting point to query additional metadata such as genre, artist information, and most importantly, mood labels.
I chose to classify songs based on Gracenote’s Level 1 moods, which contained descriptors such as “Aggressive” and “Yearning”. This was going to be an interesting 25-class classification problem! I lost some song records to the imperfect match, and had to drop or impute missing values to ensure the quality of my database. At the end, my final database consisted of over 21,000 songs with 69 potential features.
Feature Selection and Modeling
Determining what the best features and models to use turned out to be a matter of trial and error. An initial pairplot of the audio features to look for interactions showed many amorphous blobs, and it did not appear that the classes could be linearly separable. Because of all the different scales of the various audio features, I used scaling to standardize the numerical data. I attempted principal components analysis to reduce the number of features, but this proved to be ineffective as the features were already quite meaningful on their own.
I initially experimented with several classifiers in the Scikit-learn toolkit, including logistic regression, the K-neighbors classifier, support vector machines and random forests. Random forests consistently scored higher than the other classification methods on my test set, I suspect because of the scale of the problem (25 classes) and their ability to handle non-linear and categorical features. With that, I chose to focus on ensemble methods to move forward and evaluate feature importances.
One technique to evaluate features is to add random noise variables to a model and see which features are more predictive than random noise. Of my 69 features, 10 audio features and track popularity emerged as being the most important using this method. Surprisingly, genre and explicitness turned out to be less predictive of mood than random noise!
I chose to compare these results across different ensemble method - random forests, gradient boosted trees and the Kaggle-winning XGBoost. Without much tuning, my random forests had the best results with a precision metric of .37; this meant that of the predictions for a certain class, 37% were actually relevant. This was decent for a 25-class problem, but could we do better?
A Method (or Mood) to the Madness
By treating the 25 moods as being independent of each other, I was omitting important information - that the moods were related to each other in a taxonomy, based on Gracenote’s documentation. By treating points on the arousal-positivity scale as 5 separate classes, I tried a different approach by separately predicting level of arousal and level of positivity, and then using that to triangulate the mood class.
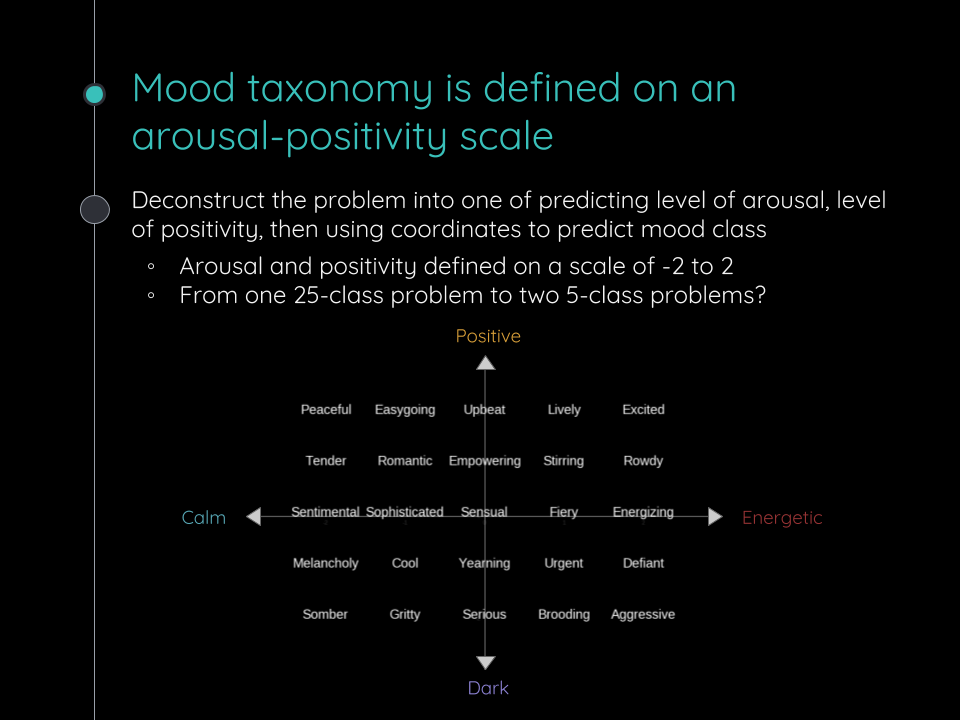
The two 5-class random forest models individually did much better than the 25-class random forest model; my arousal model had .57 precision and my positivity model had .48 precision. However, the combined result was .35 precision in mood prediction which wasn’t an improvement over the 25-class model.
Final Results and Thoughts on Modeling
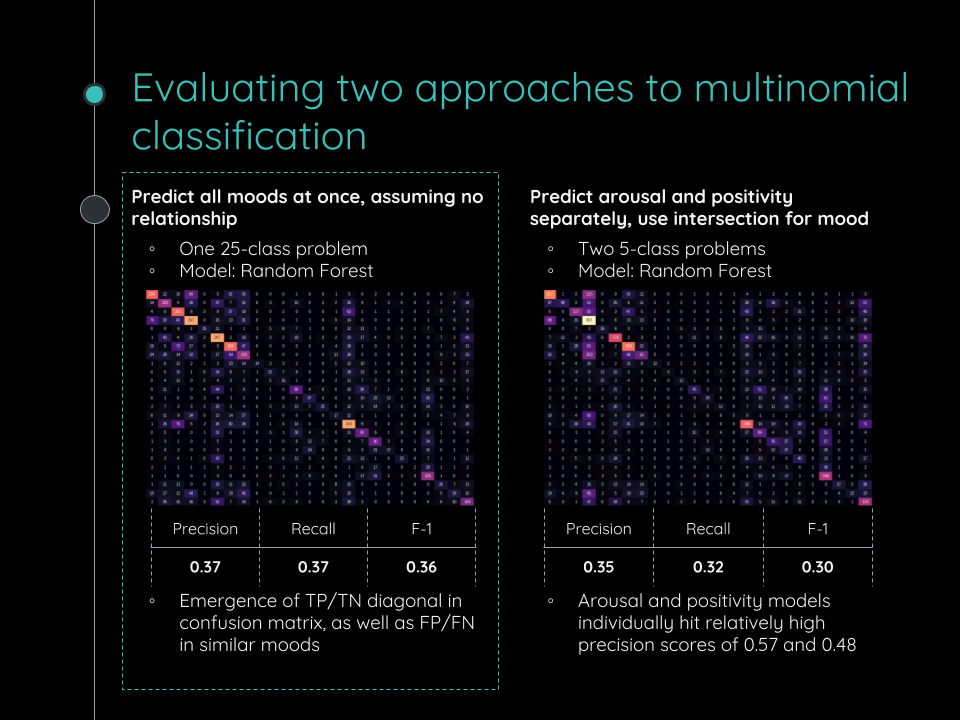
Comparing the results results in a confusion matrix, both approaches showed a pattern in the true positive/true negative diagonal, with the 25-class approach showing a slightly stronger pattern. I decided to move forward with my 25-class random forest model as a result of these findings.
Approaching this again, I may have used a weighted scoring method to evaluate the approaches based on how proximate the predicted moods were to the actual moods in the taxonomy. For example, the 25-class model tended to predict “Energizing” as “Excited” moods and vice versa, which are both high on the “arousal” scale of the taxonomy.
Production
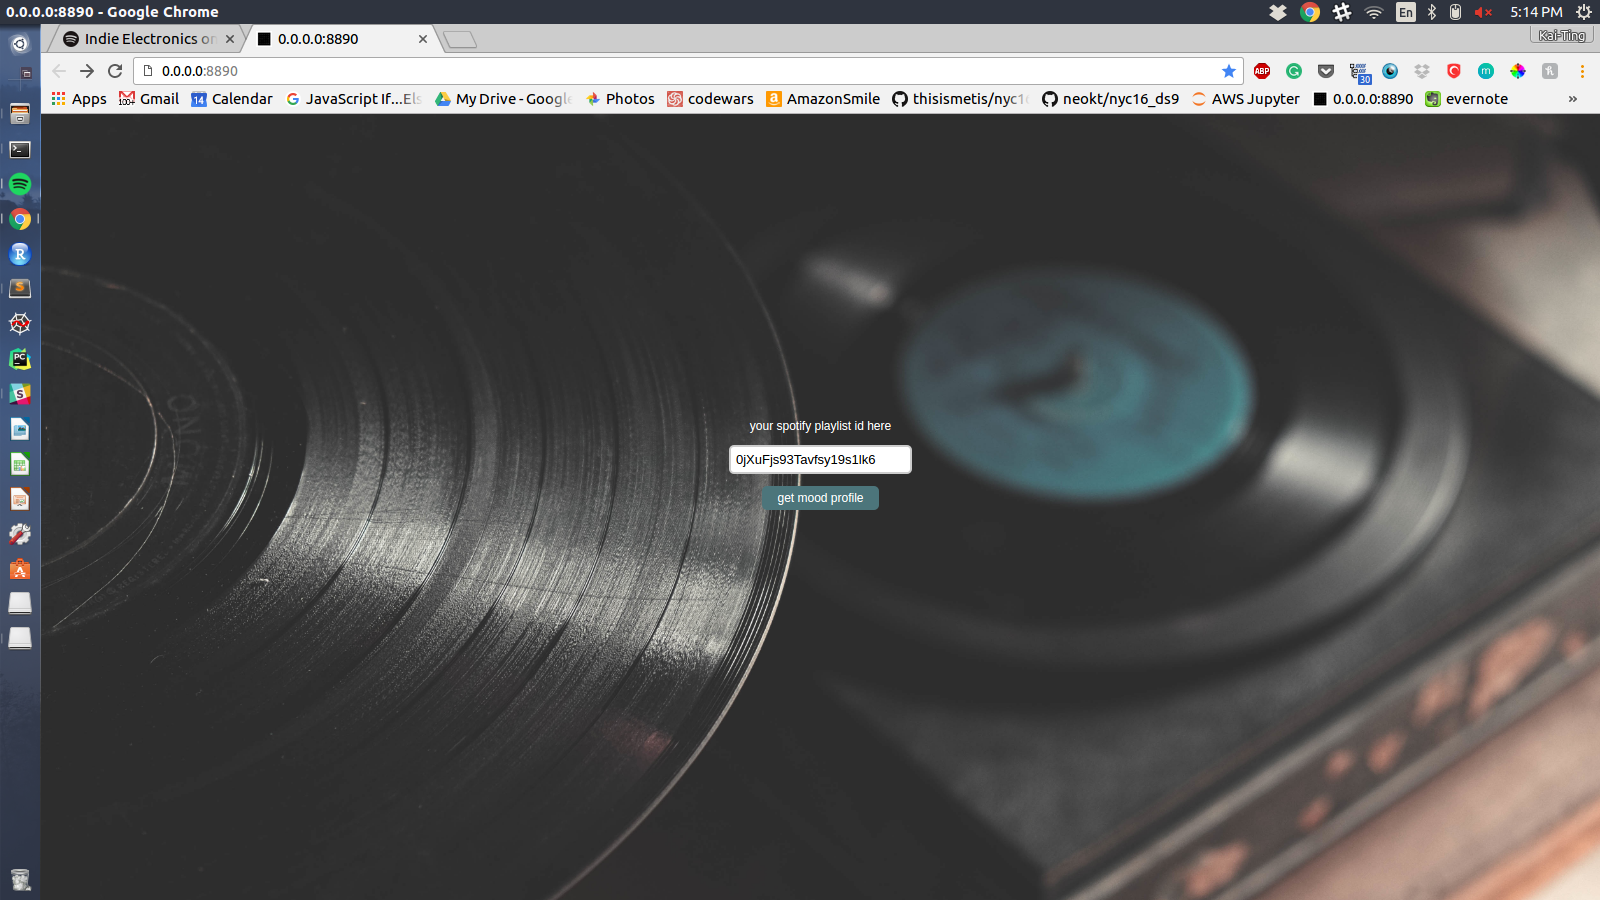
My goal was to use my predictions to create a dynamic visualization that would enable a user to see the mood profiles of their spotify playlists. I built a web app using Flask that would take in a Spotify playlist ID as input and return a colorful mood map generated using Matplotlib and Seaborn, based on my model’s predictions.
After a user inputs a Spotify playlist ID on the landing page, the app accesses Spotify’s API to identify the playlist tracks and either pulls the relevant audio features from the API or pulls the features/predictions from my database if they have been stored before. My trained model then uses these features to predict the moods for each song, and the app returns the mood map as an image.
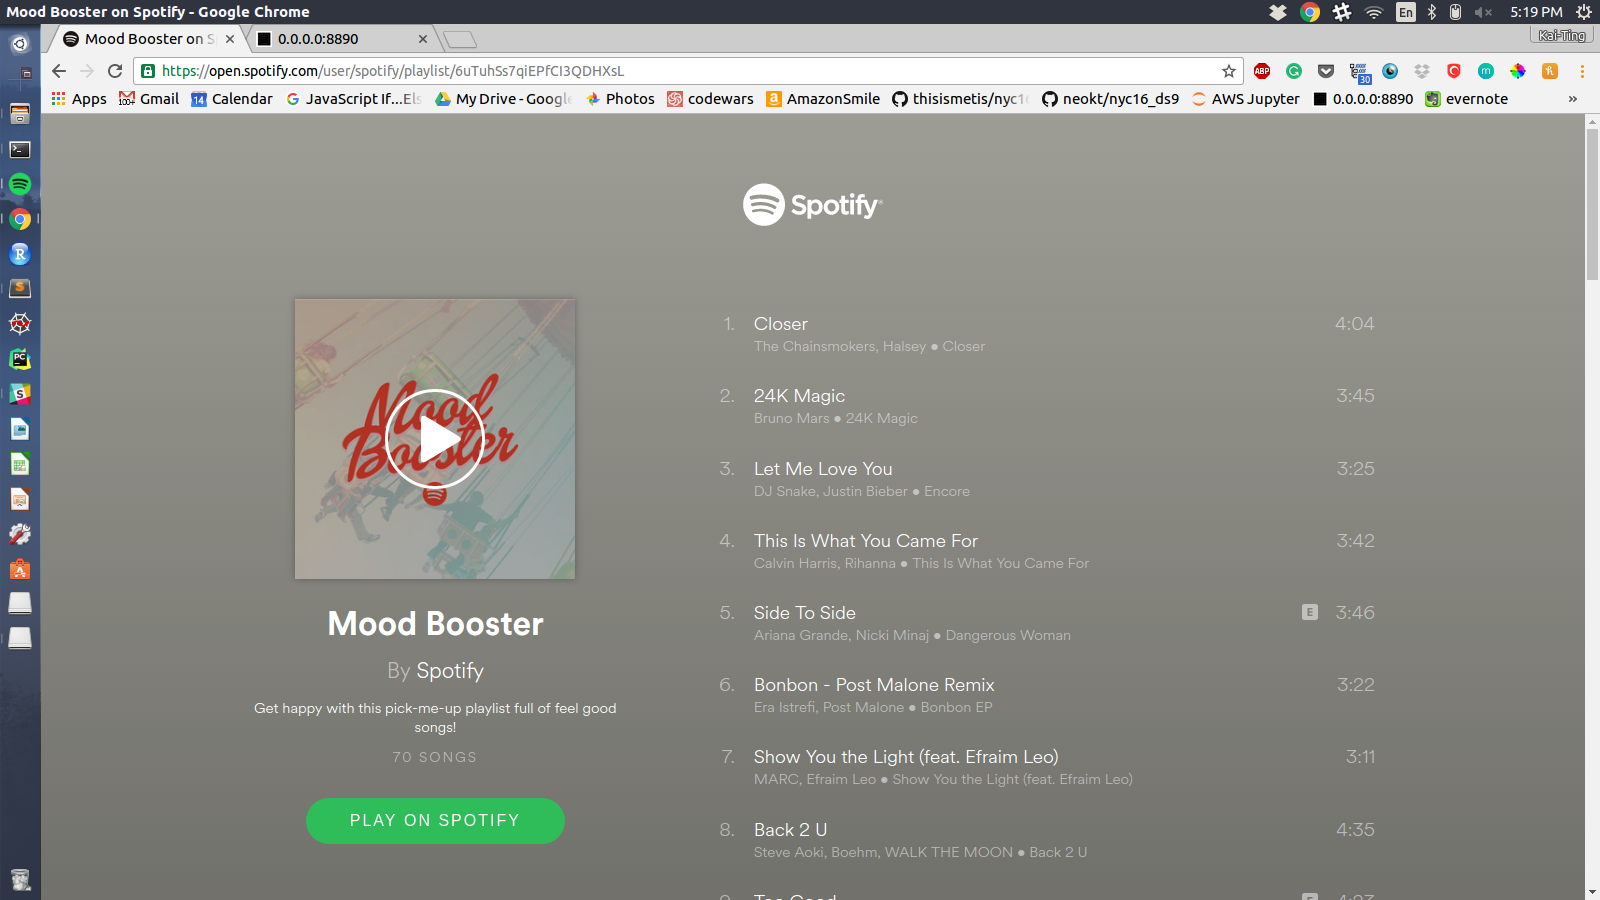
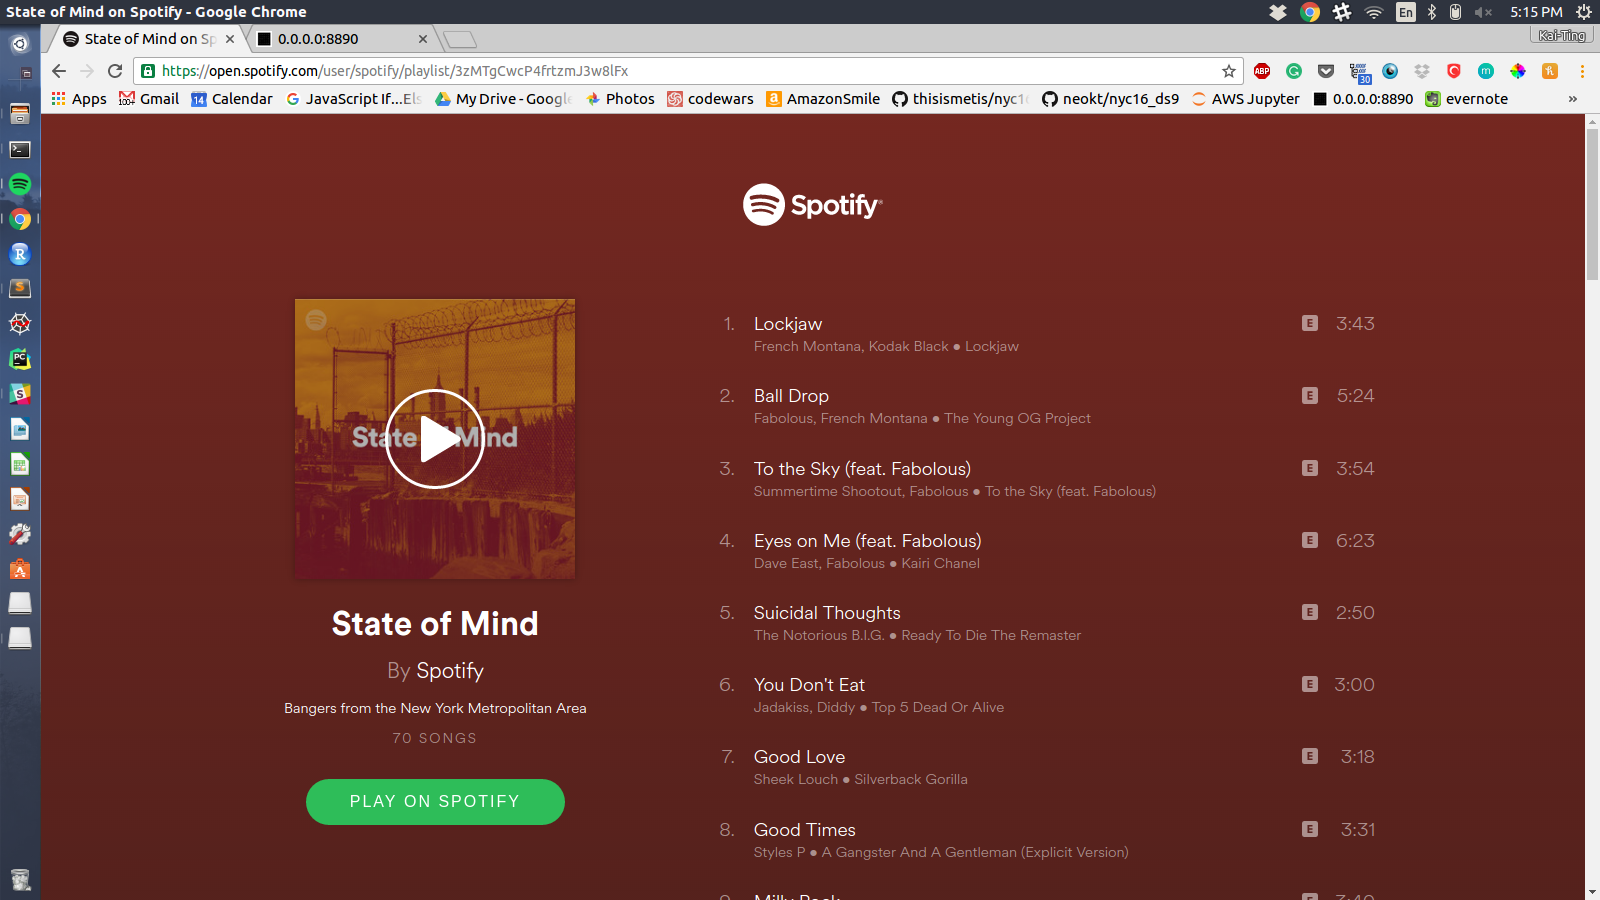
Here are some screenshots of the mood maps that my app generated using some of Spotify’s popular playlists - click to view in full size!
| Playlist | Mood Map Visualization | Top Moods |
|---|---|---|
 |
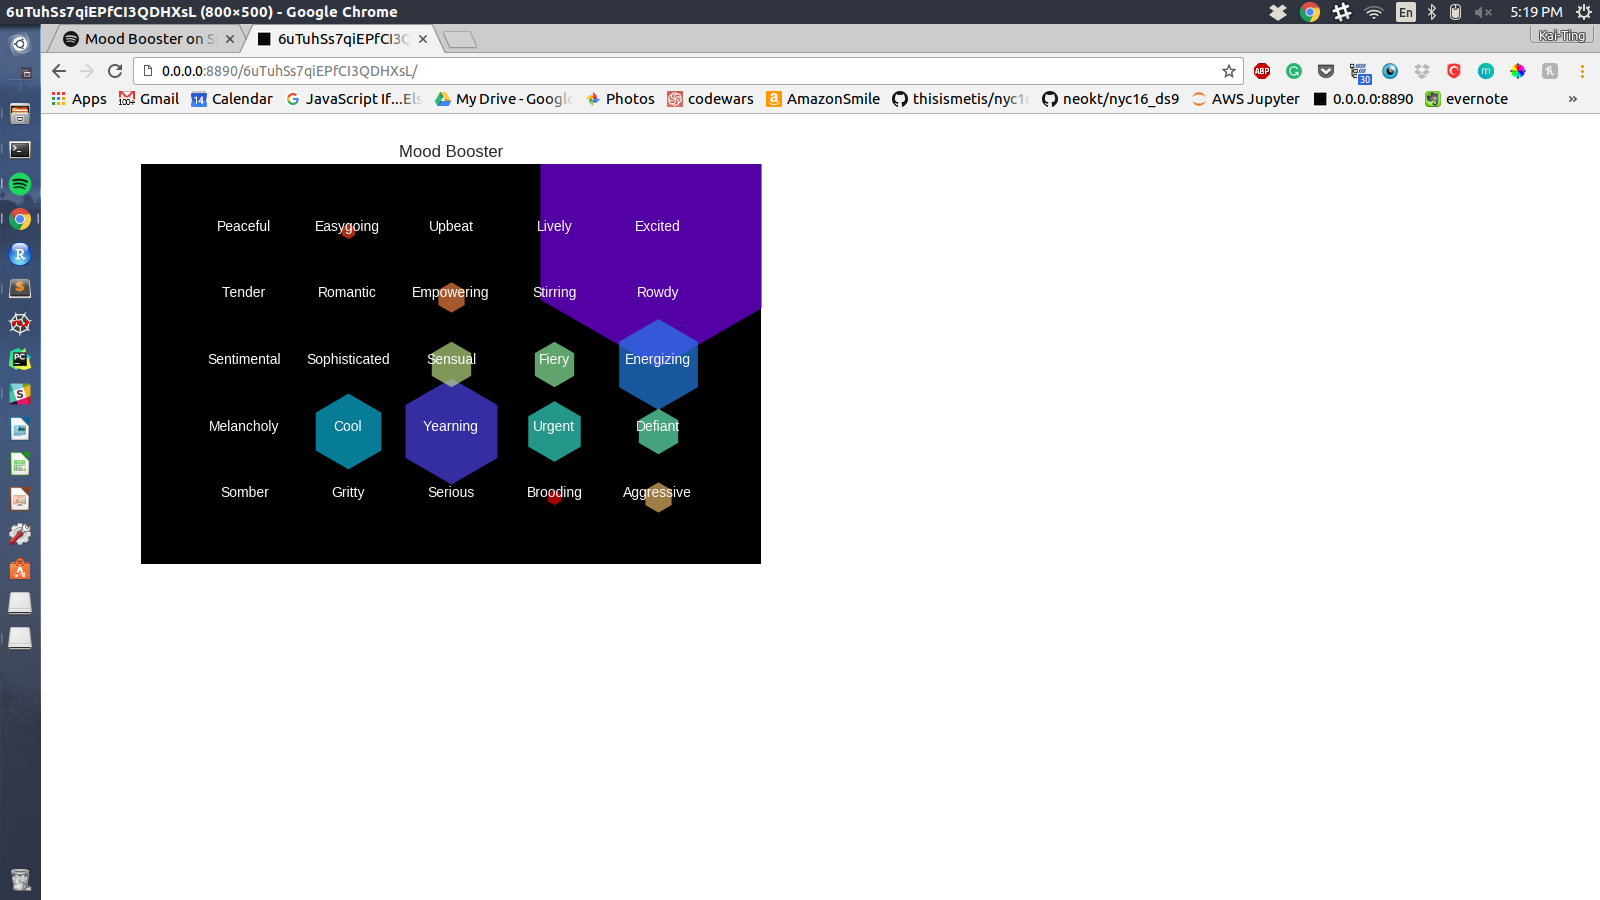 |
Mostly excited, energizing, yearning |
 |
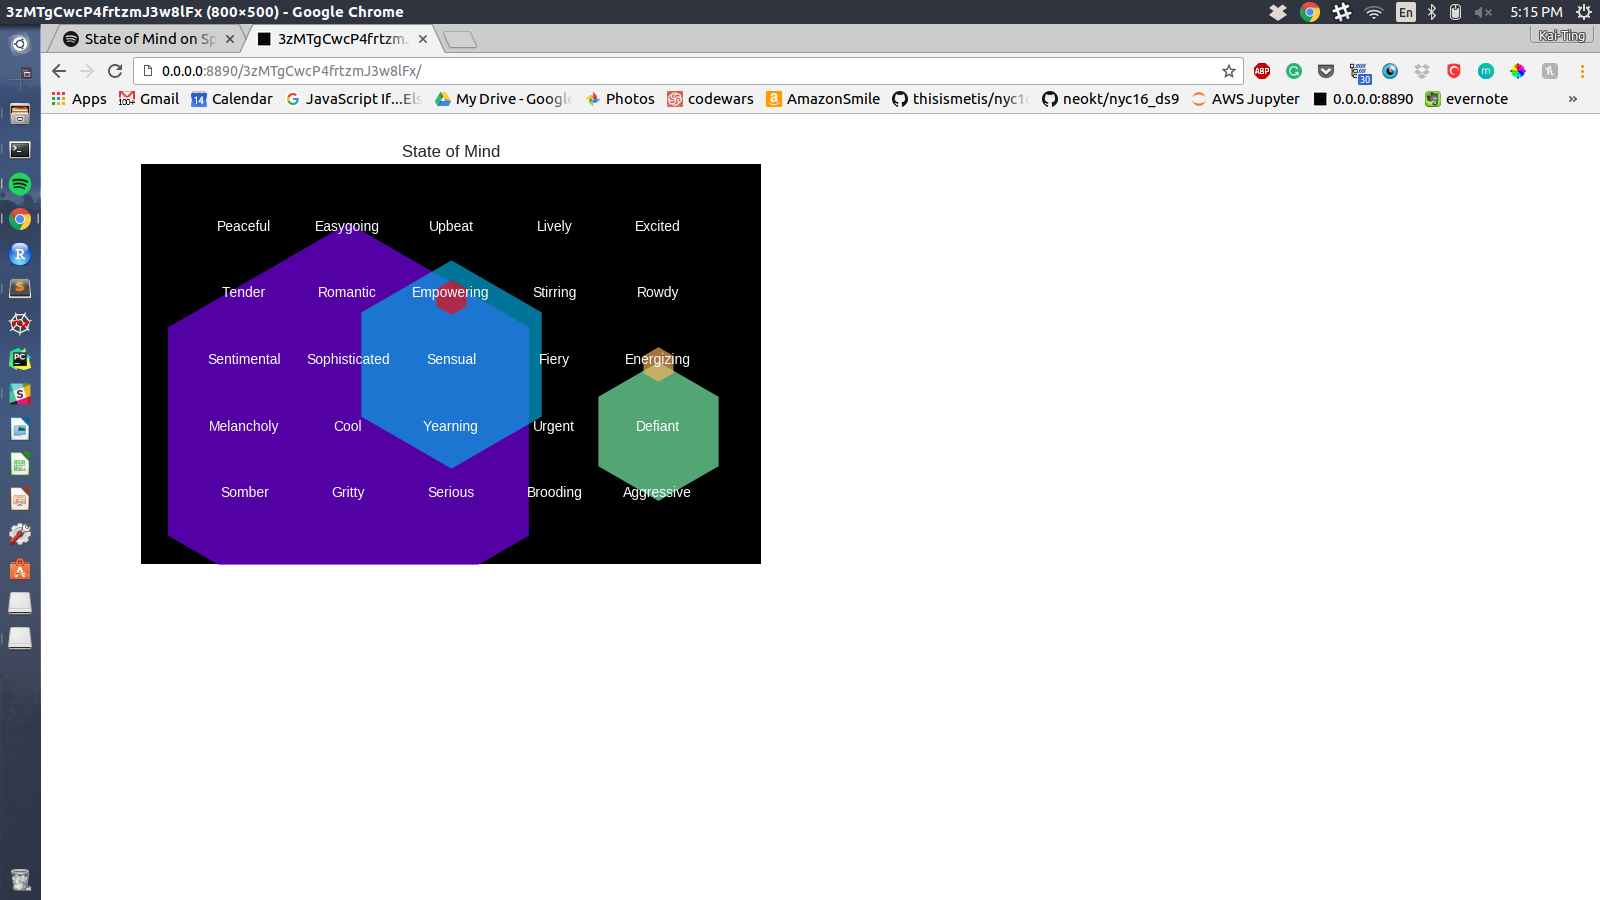 |
Mostly cool, sensual, defiant |
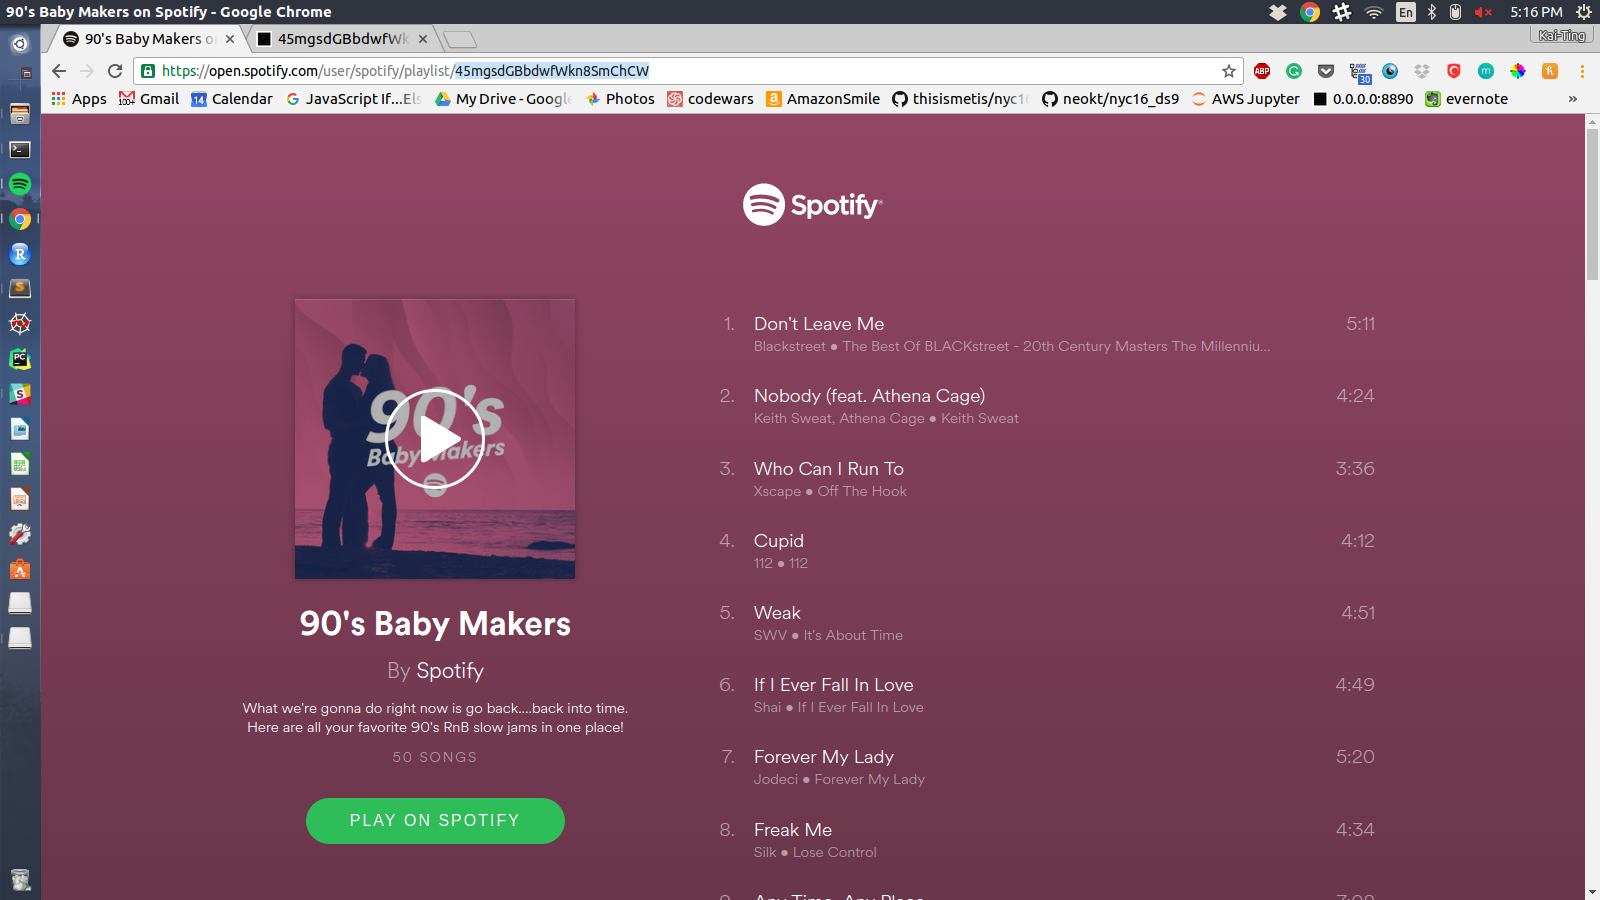 |
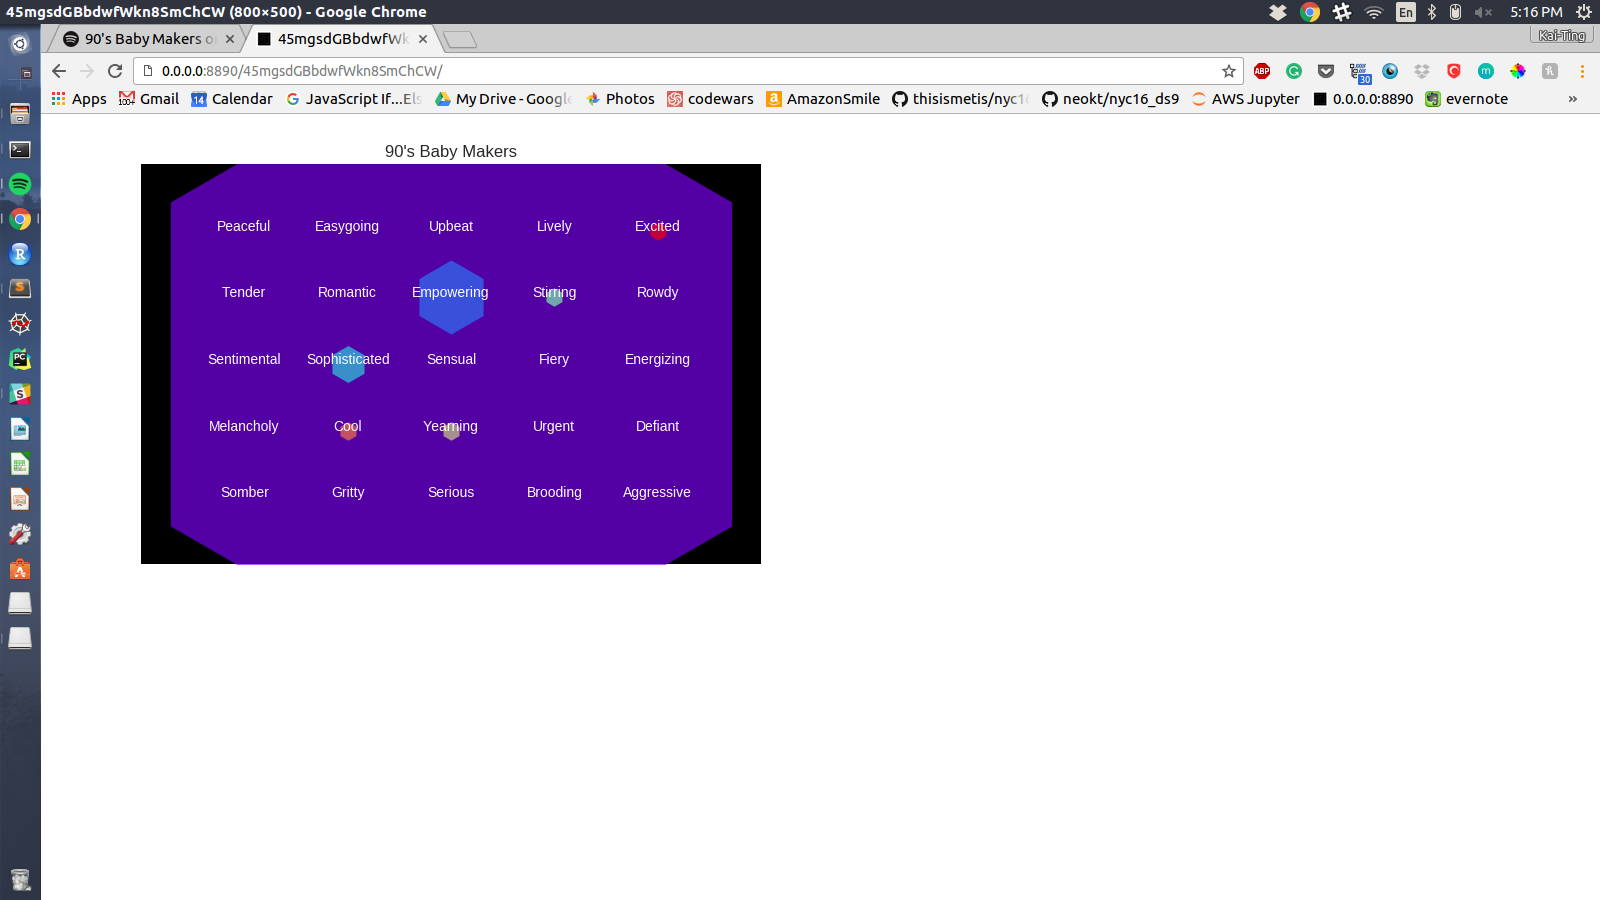 |
Overwhelming sensual! |
Future Work
Currently, my app is a prototype and does not have the full functionality that I’d like for a consumer facing utility. Some improvements that could be made:
- Make backend more robust to live predictions (e.g., storing features and predictions in PostgreSQL database)
- Incorporate Spotify user logins so user’s can import their own playlists
- Incorporate additional interactivity and mood statistics
For modeling, scaled audio features turned out to be the strongest predictors of mood using a random forest classifier. With additional time, I would attempt to tune my hyperparameters to improve the performance of my gradient boosted trees and XGBoost models to see if these could outperform the random forest model.
For future classification work, I’d like to try more creative feature engineering on a binary problem and be able to plot precision-recall and ROC curves to evaluate my classification metrics.
Questions about my analysis? Feel free to check out my github or send me an e-mail at neo.kaiting@gmail.com.
Leave a Comment